Available immediately · Hyderabad, Bangalore or Remote

Data Analyst who ships
decisions, not dashboards.

I turn messy, multi-table data into findings a business can act on — using SQL, Python and clear visual reporting. Computer Science Engineering graduate, Google Data Analytics certified, with three years running real commercial operations before I ever wrote a query.

That operations background is the point: I know what makes a report actually useful to the person reading it, not just accurate.

3 yrs
Business operations
3
End-to-end projects shipped
96K+
Orders analysed in SQL
B.Tech
CSE · JNTUH 2026

Selected work

Three projects, three different problems.
E-Commerce Sales & Customer Retention Analysis
Flagship Complete
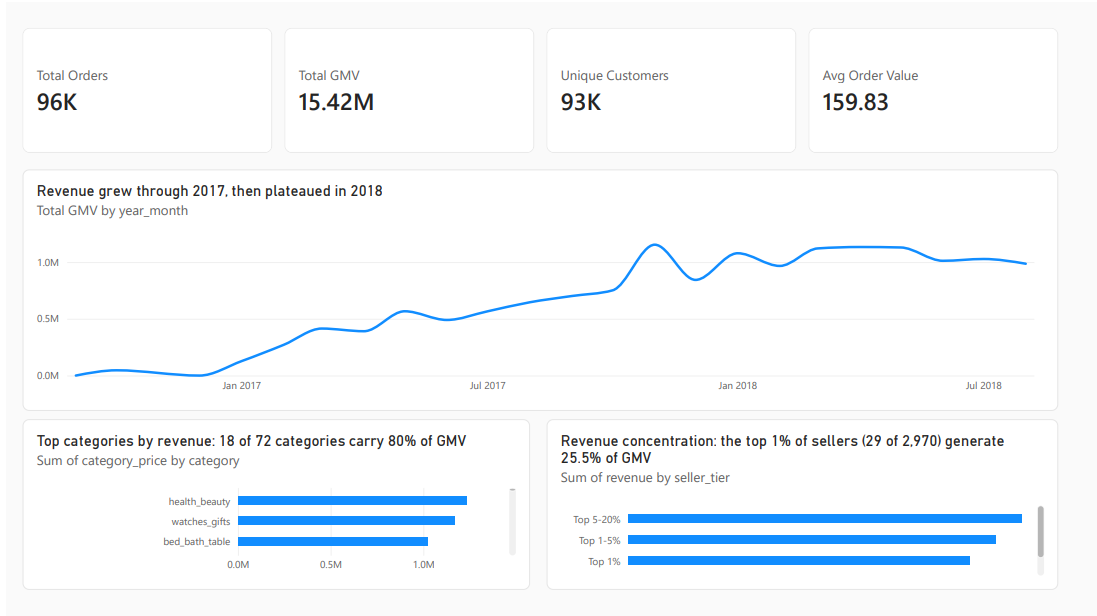
96,478 delivered orders · R$15.4M GMV · 9-table relational schema · SQL · Power BI

A marketplace was growing its top line. The question I framed was whether it was actually healthy — revenue growth hides a broken retention engine very well. Nine normalised tables, so this was answered in SQL rather than in a single dataframe.

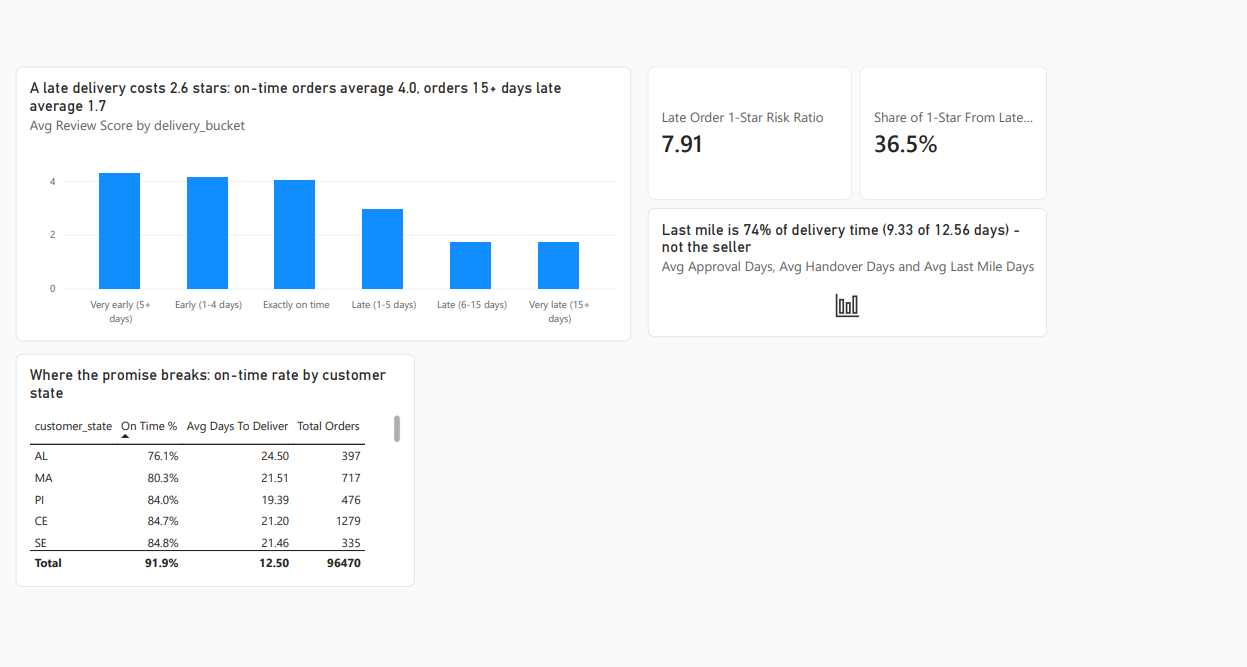
  • A late order is 7.9× more likely to get 1 star. Orders arriving 15+ days late average 1.72 stars against 4.30 for early deliveries. Late orders are just 6.8% of volume but produce 36.5% of all 1-star reviews.
  • I was wrong about the bottleneck — and the data said so. I expected slow seller dispatch. Decomposing delivery into three stages showed last-mile carrier transit takes 9.33 days against 2.80 for seller handover: 74% of the timeline, 3.3× larger. The fix is carrier routing, not seller SLAs.
  • A 3.00% repeat purchase rate. 90,557 of 93,358 customers ordered exactly once. The business runs almost entirely on paid acquisition with no retention offset.
  • 29 sellers generate 25.5% of GMV. Out of 2,970. Concentration risk invisible on any dashboard reporting totals only.
PostgreSQLCTEsWindow functions NTILE / RFMCohort retentionPareto analysis Python · pandasPower BIDAXStar schemaData visualisation
Power BI page 1 - Delivery Performance Power BI page 2 - Executive Overview
Power BI: 2-page report on a star-schema model (6 tables, 4 relationships, marked date dimension) with 33 DAX measures including time intelligence. Every measure reconciled against the SQL output.
Global Tourism & Air Transport Safety Forecasting
Complete
Final year major project · 4-member team · Jul 2025 – Apr 2026

Does tourism demand track air transport intensity — and can it be forecast reliably? I integrated six real-world datasets covering tourist arrivals and departures, air passenger volumes and aviation safety indicators, then built and compared three forecasting approaches rather than defending a single one.

  • Built a reproducible pandas preprocessing pipeline — country-name standardisation across inconsistent sources, forward/backward-fill imputation, duplicate aggregation, IQR-based outlier capping — with the rationale documented for every treatment rather than records dropped silently.
  • Engineered year-over-year growth rates, indexed trend series, volatility measures and lag sequences for supervised time-series learning.
  • Trained ARIMA, Prophet and an LSTM network, then recommended the most interpretable model for the use case — not simply the lowest error.
  • Presented model comparisons to an academic review panel, translating statistical output into plain language for non-specialists.
Pythonpandasstatsmodels ARIMAProphetLSTM · Keras MatplotlibJupyter
Bellabeat Wellness Case Study
Complete
Google Data Analytics Professional Certificate — Capstone

Smart device usage data analysed end to end through the full six-phase framework (Ask, Prepare, Process, Analyze, Share, Act), closing with marketing recommendations for a wellness technology product team.

  • Cleaned and validated the source fitness-tracker dataset in Excel and SQL, resolving formatting inconsistencies and verifying integrity before any analysis ran.
  • Surfaced behavioural usage patterns and built the supporting visualisations.
  • Delivered a stakeholder presentation with data-backed marketing recommendations.
SQLExcelData cleaning Stakeholder reporting

Toolkit

What I actually use, not what I've heard of.
SQL & Databases
PostgreSQLMySQLJoins CTEsROW_NUMBERRANK LAG / LEADNTILESubqueries GROUP BY / HAVINGQuery optimisationIndexing
Python
pandasNumPyMatplotlib statsmodelsscikit-learnProphet KerasJupyterGit / GitHub
BI & Visualisation
Power BIDAXTableau Looker StudioExcel · pivot tables VLOOKUP / INDEX MATCHDashboard designKPI definition
Analysis & Statistics
EDACohort analysisRFM segmentation CorrelationTrend analysisTime series forecasting Hypothesis testingA/B testing
Data Preparation
Data cleaningWranglingMissing value imputation DeduplicationOutlier detection · IQR / z-score ValidationFeature engineeringETL concepts
Business
Requirement gatheringStakeholder management Data storytellingExecutive presentation Cross-functional collaborationTeam leadership

Track record

Three years of commercial reality before the queries.
Business Operations & Digital Marketing
Sanjay Numberplates, Hyderabad
Feb 2021 – Present

Run online order operations end to end for a legacy manufacturing business with a recently launched e-commerce channel. Track order volumes, enquiry sources and channel performance to inform pricing and marketing decisions, and report those trends to business stakeholders as practical recommendations rather than raw numbers.

Customer Support Associate
Foundever — Verizon process
Oct 2025 – Jan 2026

High-volume, SLA-driven enterprise support. Consistently met quality assurance and resolution-time targets while operating inside the strict compliance and documentation standards typical of large regulated organisations.

Operations & Delivery Lead
House of Peak
Oct 2024 – 2025

Owned lead generation and digital marketing delivery for client accounts from brief to execution. Reported campaign performance back to clients — explaining results and recommending adjustments — while coordinating concurrent engagements on schedule.

Logistics Head, Quality Education Team
Street Cause Hyderabad · Hyderabad Youth Assembly S13
2024

Top-10 fundraiser in the chapter (≈₹25,000 raised). Managed fund allocation and procurement, and delivered Season 13's first completed project — a water purifier installed at Zia-Ul-Islam School, inside a ₹15,000–18,000 budget.

Credentials

Certifications
Google Data Analytics Professional CertificateCoursera · 8-course program with capstone
Build Real-World AI Applications with Gemini & ImagenGoogle Cloud
Prompt Design in Vertex AIGoogle Cloud
5-Day Python ProgramCodingWise · 2026

Background

Education
B.Tech, Computer Science Engineering Swami Vivekananda Institute of Technology, JNTUH — Hyderabad
2022 – 2026 · CGPA 7.15

Relevant coursework: Database Management Systems, Data Structures & Algorithms, Python Programming, Statistics & Probability, Machine Learning, Data Mining.

Languages: English, Hindi, Urdu

Let's talk

Looking for a Data Analyst role.

Hyderabad, Bangalore, or fully remote. Available to start immediately. If you have a problem that needs someone who'll question the data before charting it — get in touch.